An Anatomy of Turkish Foreign Policy: 1995 – 2020, Issue 1
This report serves as an introduction to a series of short analyses on the anatomy of Turkish Foreign Policy (TFP) in the past twenty-five years. Our goal is to quantify TFP’s evolution between 1995 and 2020 through a data-driven account free of speculative remarks. In this report, we will focus on the overall trends of TFP by starting with the global level and gradually moving to the regional and the dyadic levels. We will focus on the evolution of dyadic relations with specific countries in the subsequent analyses.
The Data: ICEWS
The present analysis draws on Lockheed Martin Advanced Technology Lab’s Integrated Crisis Early Warning System (ICEWS) event database (Lautenschlager et al., 2015). ICEWS features directed dyadic observations constructed through natural language processing methods on data gathered from over 30 million media reports belonging to about 275 global and local news sources. Each ICEWS observation follows the same format: who (source) did what (action) to whom (target), when (time), and where (location). The observation’s interaction is then assigned one of 312 different event types in accordance with the Conflict and Mediation Event Observation (CAMEO) coding protocol (Schrodt, 2012). The following is a random observation from the database: “Turkey hosts a visit from the United States Secretary of State Mike Pompeo on October 18th, 2019, in Ankara, Turkey (39.9167, 32.8333).” Finally, each event type is assigned an event intensity value that ranges between -10 and +10, where the former suggests an extreme form of conflict (i.e., “use of conventional military force”), and the latter suggests an extreme form of cooperation (i.e., “declare military truce”). For example, the event intensity value of “hosts a visit” is 3.2, suggesting a low to mid-intensity cooperative interaction from Turkey to the United States.
TFP: An Overview
How frequently does Turkey engage with others, and what is the nature of its interactions? The data described below covers the period between January 1st, 1995, and April 30th, 2020. In this timeframe, Turkey initiated 186,255 interactions between 1995 and 2020, according to the ICEWS database. This number corresponds to a little over one percent of the 17,955,660 global interactions. Table 3.1 below compares the summary statistics of the World and Turkey.

The summary statistics for Turkey’s interactions provide an informative overview. The median and the left skew of the distribution suggest that Turkey initiated more cooperative interactions than conflict-prone interactions between 1995 and 2020. However, as the kurtosis of the distribution suggests, most of the initiations were clustered around low-stakes cooperative interactions. Turkey’s descriptive statistics vis-à-vis the World suggest that Turkey was more cooperative than the average country within the period under consideration. Figure 3.1 and Figure 3.2 below provide the distributions of event intensity scores for the whole period for Turkey and the World. In both distributions, any value to the left of 0 suggests a conflictual interaction and to the right suggests a cooperative interaction.
[iheu_ultimate_oxi id=”3″]
[iheu_ultimate_oxi id=”4″]
The frequencies of aggregate interactions over time provide more insights into the evolution of TFP. Figure 3.3 below demonstrates the frequency of both cooperation and conflict initiations by Turkey by year. The figure suggests that TFP roughly went through four phases. The first phase corresponds to 1995 and 2001; the second phase to 2001 and 2011; the third phase is 2011 to 2014; and the fourth phase is between 2014 and the current day.[1] The first phase can be seen as an initial acceleration of Turkey’s internationalization. However, the second phase underpins the period when the country’s international interactions were at their peak. The third phase can be viewed as a deceleration of international interactions. The fourth phase is underpinned by the country’s restraint in its foreign policy, given the observable increase in the frequency of conflict initiations. Four years are marked by sudden shifts in TFP: 2002, 2011, 2014, and 2016. The rate of increase in cooperation initiations for the year 2012 is unmatched in modern TFP. In contrast, 2011 is marked by an unparalleled contraction in cooperation initiation. The rate of increase in conflict initiation is highest in 2014. Given the coup attempt, the sudden deceleration in both cooperation and conflict initiation during 2016 is not surprising.
The distribution of interaction intensity over time provides interesting insights as well. Figure 3.4 below summarizes the interaction intensities by year. The increase in high-intensity conflicts post-2014 and the decrease in cooperative interactions in the same year are quite observable. Furthermore, there is a consistent increase in the low and mid-intensity conflict initiations following 2011.
[iheu_ultimate_oxi id=”6″]
[iheu_ultimate_oxi id=”8″]
TFP: Regional Focus
Do the patterns of TFP vary by region? We can discern considerable information regarding TFP’s evolution at the regional level. Accordingly, three regions play a significant role: the West, the Middle East, and the East. Below, Figure 4.1 focuses on the evolution of TFP towards the West, Figure 4.2 towards the Middle East, and Figure 4.3 towards the East.[2] The summary statistics for each region’s distribution are presented in Table 4.1 below. Summary statistics for all years for each region provide interesting insights for TFP over the past twenty-five years. While the distributions for the West and the East are relatively normal-looking with left skews and high kurtosis, which point to the prevalence of low to mid-level cooperative interactions, the distributions for the Middle East have high spreads suggesting the prevalence of high-intensity conflict and cooperation.

TFP towards the West can be summarized in three phases: 1995 to 2000, 2001 to 2011, and post-2011. The first phase is marked by the high frequency of low to mid-intensity cooperative interactions and occasional instances of mid to high-intensity conflict initiation. The second phase can be seen as a rapprochement with the West. During this period, there are no high-intensity conflicts; however, the frequency and intensity of the cooperative interactions resemble that of the first phase. The third phase presents a remarkably different picture: a gradual decline in the frequency and intensity of cooperative interactions and an increase in the frequency and intensity of conflict-prone interactions with the West.
TFP towards the Middle East is considerably different from that of the West. The distributions can be grouped under roughly three phases that coincide with the same periods that were discussed above. Between 1995 and 2001, the first phase features a high frequency of high and mid-intensity conflicts and a low frequency of low-stakes cooperative interactions. The second phase between 2001 and 2011 suggests a relatively reformed approach: a gradual decrease in high-intensity conflicts and an increase in low and mid-level intensity cooperative interactions. The third phase in post-2011 reverses this reform, given the acceleration of both the increase in frequency and intensity of conflictive interactions and the gradual decrease in cooperative interactions.
TFP towards the East, a region that is increasingly becoming more relevant given the global pivot towards East and Southeast Asia, can be summarized under two phases: pre-2011 and post-2011. The former is marked by high frequency and intensity of cooperation, and the latter is marked by growing frequency and intensity of conflict. It should be noted that the available data on this region is only about ten percent of the other two regions we discussed.
[iheu_ultimate_oxi id=”13″]
[iheu_ultimate_oxi id=”11″]
[iheu_ultimate_oxi id=”9″]
TFP: Moving toward the Dyadic Analysis
The dyadic level analysis provides the most fine-grained information regarding TFP. However, it is necessary to understand which dyads matter before focusing on specific dyads. Which countries does the Turkish state engage with the most? Figure 5.1 below answers this question. Between 1995 and early 2020, Turkey’s top five interaction partners, regardless of the interaction nature, were the US, followed by Russia, Iraq, Syria, and Iran. Among other regional powers, Israel was 6th, Germany 9th, France 11th, the UK 12th, China 18th, and Saudi Arabia 19th. Figure 5.1 also provides guidance regarding the subsequent steps of our analysis: it informs us which countries mattered the most for TFP during the past twenty-five years.
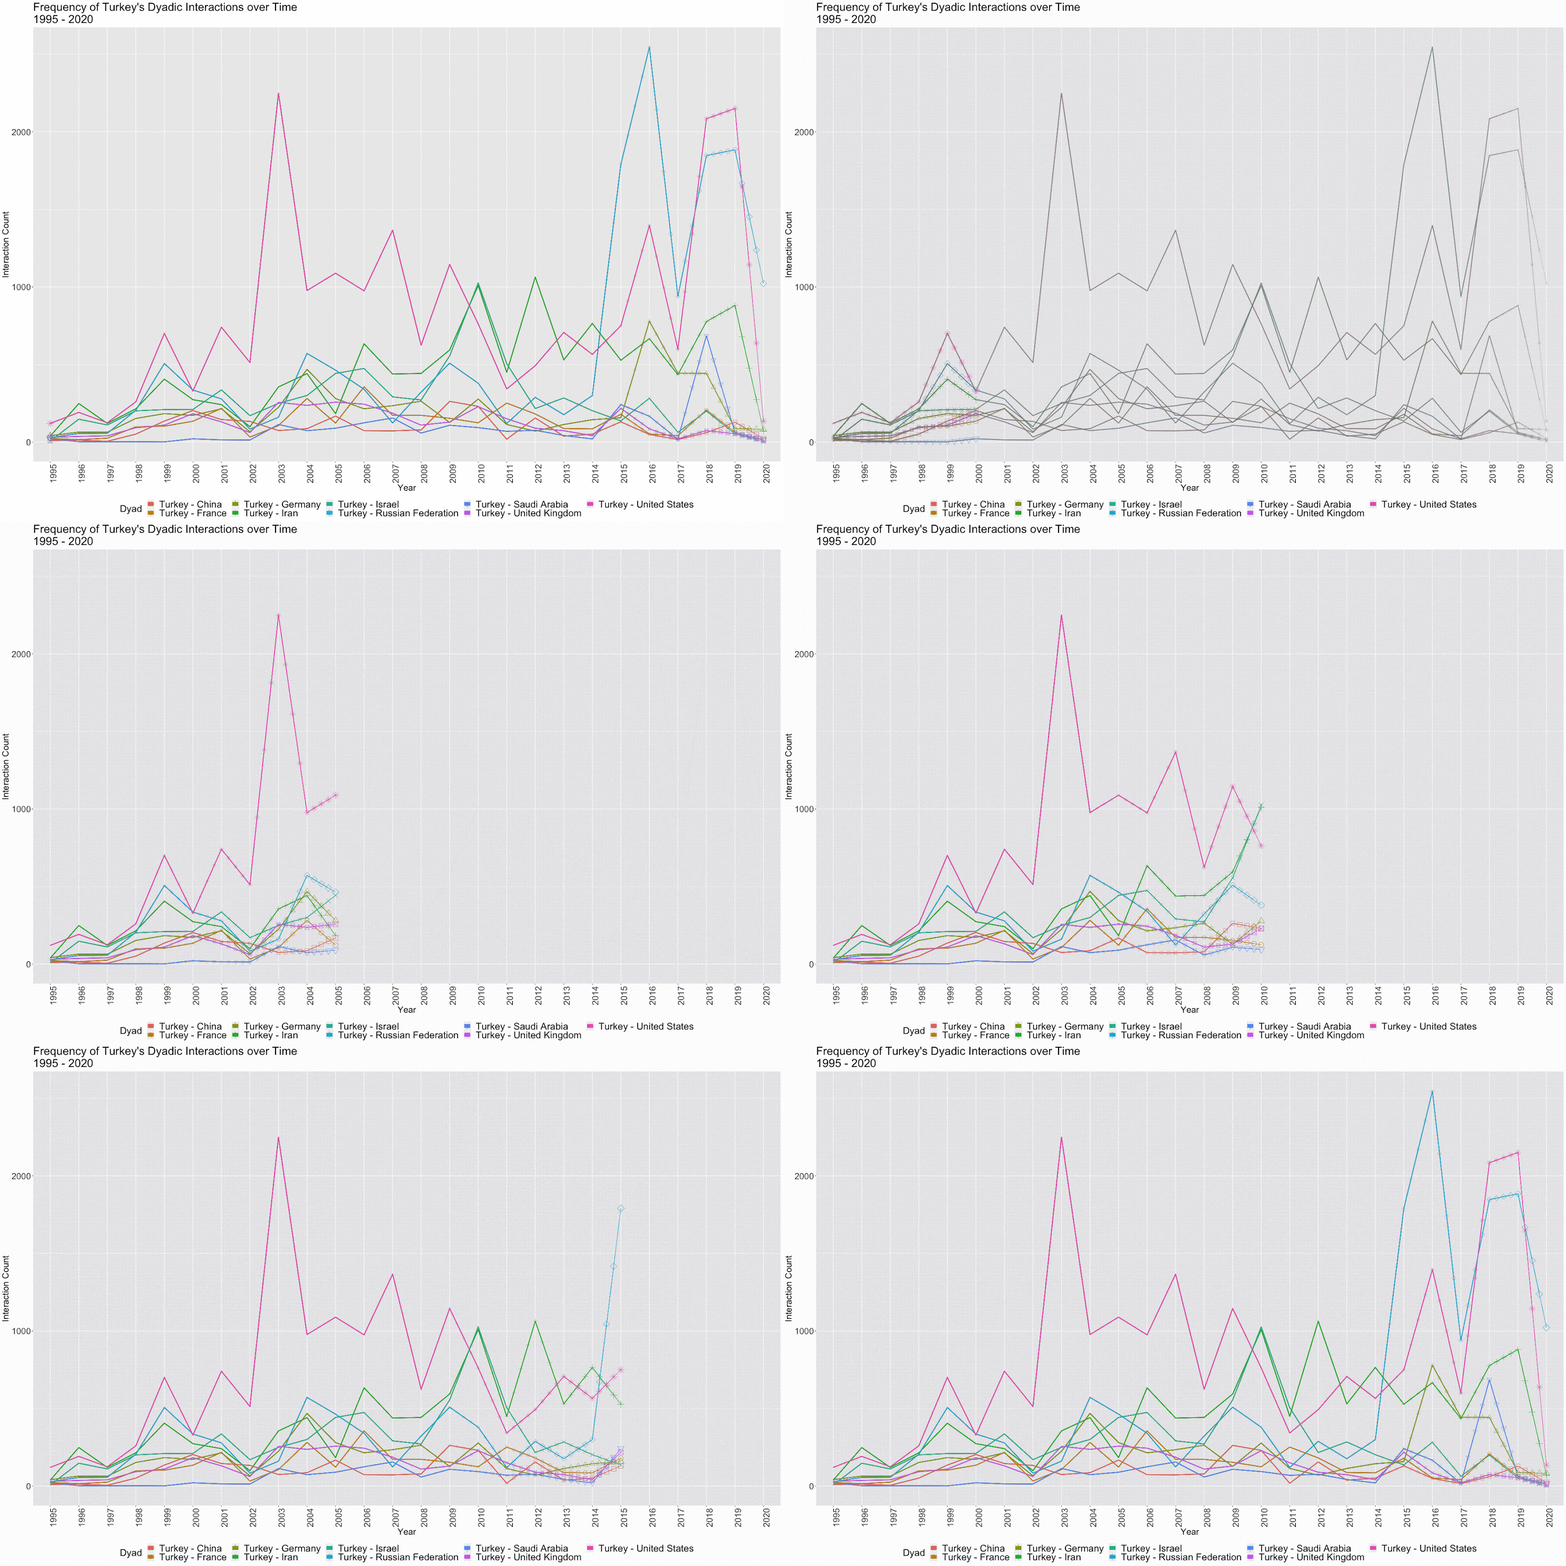
Disaggregating the frequencies at the dyadic level allows us to distill more information. Figure 5.2 provides annual interaction frequencies with eight countries. While interactions with the US have always been high between 1995 and 2020, 2014 marks the year when Russia became as salient of a dyadic partner to Turkey as the US. Iran and Israel were two other regional powers that constantly remained on Turkey’s TFP agenda. The sum of interaction frequencies with the mentioned European countries would be placed below Russia in the third spot on the figure.
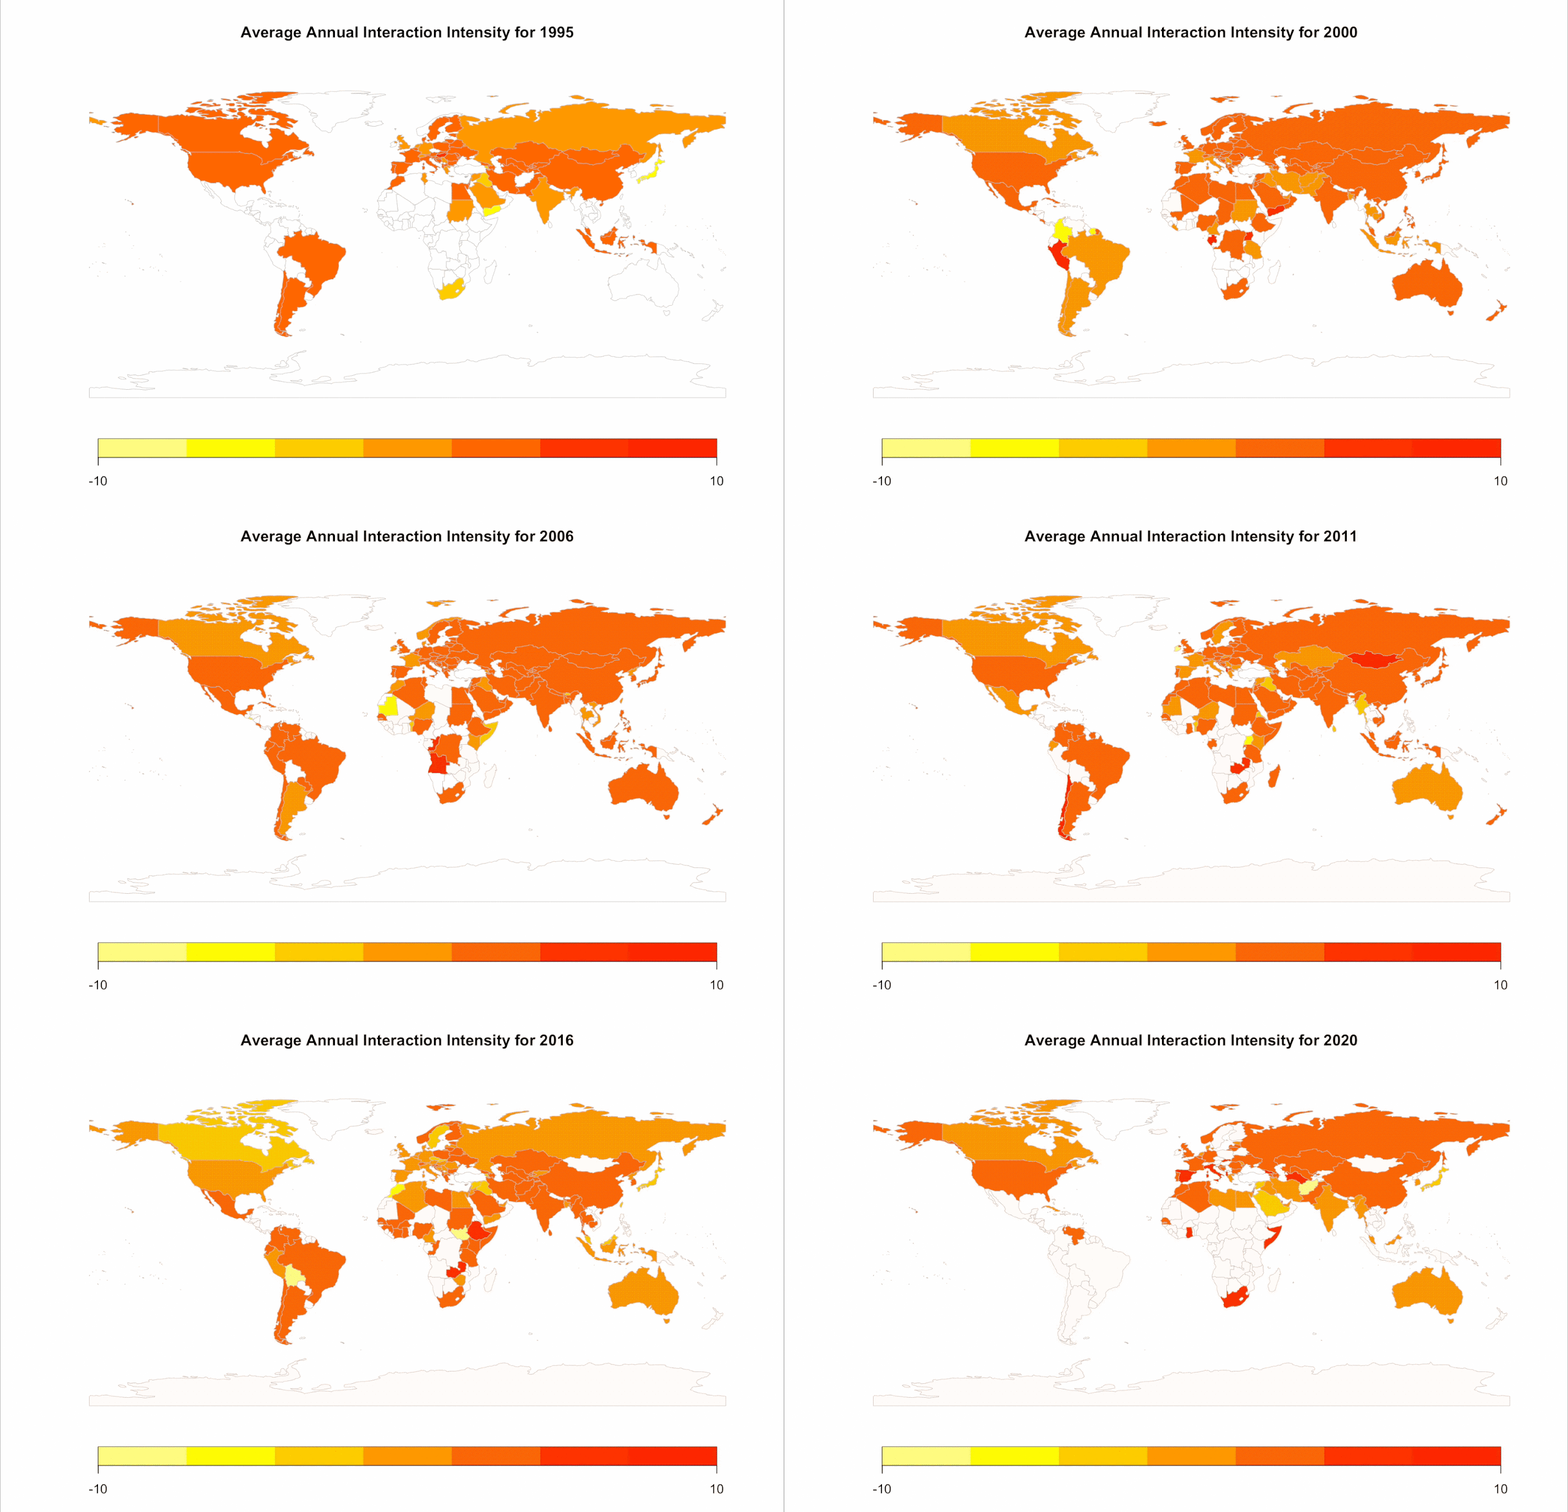
Measuring the intensity of interactions, however, is essential in understanding the nature of dyadic relations. What was the tone of TFP towards a specific country for a given year? To answer this question, we carry out a simple annual average calculation of interaction intensity scores. We provide the averages for all Turkey’s dyadic partners in Figure 5.3 below: the redder a country is, the more cooperative Turkey’s relations are towards the country, and the yellower a country is, the more conflictive Turkey’s interactions with the country are for a given year.
[iheu_ultimate_oxi id=”12″]


Next Steps In the Project
This study quantifies the trends in TFP for the past two and a half decades by exploring publicly available data. Our main finding is that cooperation initiation towards the Rest of the World has been higher compared to conflict initiation, as both the summary statistics and the world map display. In the subsequent analyses, we will focus on the evolution of bilateral relations between Turkey and other countries.
[1] It should be noted that the data is available until the end of April 2020. Therefore the 2020 datapoint does not take into consideration the subsequent eight months of the year, which understates the total number of interactions. A conservative estimate would suggest a similar frequency of interactions with that of 2019.
[2] Countries in the West include Austria, Belgium, Bulgaria, Croatia, Cyprus, Czechia, Denmark, Estonia, Finland, France, Germany, Greece, Hungary, Ireland, Italy, Latvia, Lithuania, Luxembourg, Malta, Netherlands, Poland, Portugal, Romania, Slovakia, Slovenia, Spain, Sweden, United Kingdom, Canada, United States, Australia, and New Zealand. Countries in the Middle East include Afghanistan, Egypt, Iran, Iraq, Israel, Jordan, Kuwait, Lebanon, Oman, Pakistan, Qatar, Saudi Arabia, Syria, United Arab Emirates, and Yemen. The East includes Brunei, Cambodia, China, India, Indonesia, Japan, Laos, Myanmar, Philippines, Singapore, South Korea, Taiwan, Thailand, and Vietnam. We do not apply any weights to the interactions.
- This article has been published in cooperation with Friedrich Naumann Foundation
Fotoğraf: Jeremy Bezanger

